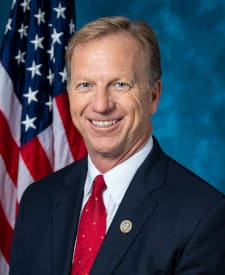
 Kevin Hern soldRepublican, Representative, OK district 1
Traded Aug 31 – Sep 2, 2026 · largest single filing $15,001–$50,000
Show all 2 filings
Sep 2, 2026$15,001–$50,000Joint
DetailsOfficial record
ORLY · NASDAQ · Automotive Retail
Automotive Retail company based in Springfield, Missouri.
In the last 90 days, no insider of O'Reilly Automotive reported an open-market purchase and 3 open-market sales worth about $551K. Members of Congress disclosed 4 trades in its stock. The latest 13F reports cover the quarter ending Jun 30, 2026. Every figure links to its official SEC, House, Senate or USAspending record.
Last closeLast close, Oct 5, 2026
$83.90
Last 12 months
−19.9%
Market value
$67.9B
S&P 500 +15.8% over the same dates. Prices adjusted for splits and dividends.
Bets against the stock: 25.7M shares sold short (3.2% of shares outstanding), −2.9% vs the previous count, 4.7 days of normal trading to buy them back. FINRA, as of Sep 15, 2026.
O'Reilly Automotive: 1 fund cut or exited a position in the latest 13F filings and 1 member of Congress disclosed sales. 2 of 3 kinds of disclosure lean the same way. This counts filings; it does not say why, or what happens next. How well this has worked
Revenue
$4.89B
+8.1% vs the same quarter a year earlier
Free cash flow, last 12 months
$2.16B
This quarter $699M, a year earlier $456M
Net debt
$6.75B
Debt $7.01B, cash $262M, at Jun 30, 2026
Net income, last 12 months
$2.65B
Operating profit covers interest 14.4x
From the company's own quarterly and annual reports to the SEC. Free cash flow (cash from operations minus capital spending), net debt (debt minus cash) and 12-month totals are calculated by OQRO. Production rates, deliveries, approvals and guidance are in its results announcement of Jul 29, 2026.
Insiders buying, last 90 days
None
No open-market purchases reported
Insiders selling, last 90 days
3 sales
$551K sold. Insiders sell for many reasons.
New federal contracts, 12 months
None
Nothing found for this company
Revenue, fiscal 2025
$17.8B
+6.4% vs the year before
Net income, fiscal 2025
$2.54B
As reported in the annual filing
Shares outstanding
809M
As of Aug 3, 2026
In fiscal 2025 the company spent $2.1B buying back its own shares. Cash actually paid, from its cash-flow statement.
Kevin Hern soldRepublican, Representative, OK district 1Traded Aug 31 – Sep 2, 2026 · largest single filing $15,001–$50,000
Sep 2, 2026$15,001–$50,000Joint
DetailsOfficial recordAug 31, 2026$15,001–$50,000Joint
DetailsOfficial recordStock since the trade −5.2% · S&P 500 +0.7% · to Oct 5
A board member of O'Reilly Automotive sold $88K of O'Reilly Automotive shares. Nobody planned it ahead of time.
Stock since the trade −8.8% · S&P 500 +0.3% · to Oct 5
O'Reilly Automotive's SVP OF PROF SALES & STORE OPS sold $279K of O'Reilly Automotive shares. Nobody planned it ahead of time.
Stock since the trade −8.8% · S&P 500 +0.3% · to Oct 5
A board member of O'Reilly Automotive sold $184K of O'Reilly Automotive shares. Nobody planned it ahead of time.
Prices are daily closes from Polygon.io. Company figures come from its own SEC filings. Past moves are not a forecast. OQRO reports what was filed and never tells you what to buy or sell.
Short sale volume: 35.7% of the volume reported to FINRA over the last 20 trading days was marked short, above its 1-year average of 31.8%. FINRA daily files, to Oct 5, 2026.
Short sale volume is not short interest. It counts trades marked short, including market makers selling short to fill buy orders, so it is a share of daily trading, not a count of bets against the stock.
Anyone owning more than 5% must file within days. Structured filings exist since December 2024, so older stakes that were never amended may be missing.
Last 12 months, adjusted daily closes
Adjusted close went from $103.30 on Oct 6, 2025 to $83.90 on Oct 5, 2026 (-18.8%). Disclosed activity in the last 12 months: 0 insider purchases, 13 insider sales, 3 Congress purchases, 7 Congress sales, 0 fund reports of opening or adding and 1 fund report of trimming or selling out (13F, quarter-end snapshots).