Want the short version?
Ask OQRO reads the filings behind this page and answers in plain words, with a link to each source.
Ask OQRO is part of OQRO Pro. Everything else on OQRO is free.
Ask OQRO reads the filings behind this page and answers in plain words, with a link to each source.
Ask OQRO is part of OQRO Pro. Everything else on OQRO is free.
Only to see which pages are hard to use, so we can fix them. Nothing is used for ads, and what you type stays hidden (Microsoft Clarity, PostHog). Privacy Policy
The latest available 13F covers holdings as of Sep 30, 2026 (Q3 2026) and was filed Nov 16, 2026. Quarter-end snapshot, not a live trade.
Disclosed 13F value
$23B
sum of reported positions
Reported positions
974
Changes vs prior quarter
1146
166 new · 189 exited
Filings on record
10
Q3 2026, Q2 2026, Q1 2026, Q4 2025, Q3 2025, Q2 2025, Q1 2025, Q4 2024, Q3 2024, Q2 2024
Across 3386 measured positions in 9 quarters, the typical new or larger position finished −0.9 pts against the S&P 500 and 48% finished ahead of it. For scale, across all 503 funds with a result: −2.1 pts typical, 44% ahead.
Measured on each position this fund reported as new or larger, from the first close after the filing became public, against the S&P 500, 90 days later. Sales are not scored. History, not a forecast; it shows what the stocks did, not what the fund knew.
Total value of the 13F each quarter. It moves with prices as well as with what the fund bought or sold, so a rise is not necessarily a purchase.
5,947 institutions report a stake.
Also among the 20 largest: Capital Research Global Investors
4,816 institutions report a stake.
Also among the 20 largest: Capital World Investors, Capital Research Global Investors, Capital International Investors
Comparison uses this manager's immediately preceding 13F-HR. Puts and calls are separate lines. Share counts drive classification; reported value also moves with price.Methodology
In its latest 13F, with holdings as of Sep 30, 2026 (Q3 2026), Bridgewater Associates reported 974 positions worth $23B. The largest: STATE STR SPDR S&P 500 ETF T, 11.3%; ISHARES TR, 5.0%; NVIDIA (NVDA), 2.7%; Broadcom (AVGO), 2.0%; Lam Research (LRCX), 1.5%. The five largest make up 23% of the reported portfolio.
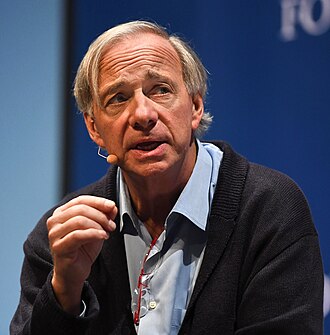
Images: Ray Dalio by Web Summit (CC BY 2.0) from Wikimedia Commons; logo by Bridgewater Associates (Public domain) from Wikimedia Commons.
Change in the reported value against the quarter before.
Weights are within the disclosed 13F portfolio, for the ten largest lines.
| Q2 2026 | Q3 2026 | |
|---|---|---|
| Reported value | $24.4B | $23B |
| Positions | 997 | 974 |
| Biggest line | — | STATE STR SPDR S&P 500 ETF T 11% |

3,096 institutions report a stake.
3,975 institutions report a stake.
3,487 institutions report a stake.
Also among the 20 largest: Capital Research Global Investors
3,873 institutions report a stake.
Also among the 20 largest: Capital World Investors, Primecap Management Co, Capital International Investors
| 2.0% |
| 0.03% |
| $348M | 1.5% | 0.08% |
| $301M | 1.3% | 0.03% |
| $288M | 1.3% | 0.07% |
| $253M | 1.1% | 0.02% |
| $243M | 1.1% | 0.20% |
| $242M | 1.1% | 0.01% |
ISHARES INC | $230M | 1.0% | — |
| $198M | 0.9% | 0.20% |
| $196M | 0.9% | 0.04% |
VANGUARD INTL EQUITY INDEX F | $188M | 0.8% | — |
SEAGATE TECHNOLOGY HLDNGS PL | $183M | 0.8% | — |
| $162M | 0.7% | 0.04% |
| $162M | 0.7% | 0.08% |
| $160M | 0.7% | 0.01% |
| $159M | 0.7% | 0.10% |
| $158M | 0.7% | 0.00% |
| $145M | 0.6% | 0.02% |
| $141M | 0.6% | 0.13% |
ISHARES INC | $134M | 0.6% | — |
| $131M | 0.6% | 0.18% |
| $129M | 0.6% | — |
STATE STR SPDR S&P 500 ETF T
5.32M → 3.4M shares (−36%)
ISHARES TR
3M → 1.51M shares (−50%)
NVIDIA (NVDA)
3.87M → 2.69M shares (−31%)
Lam Research (LRCX)
938K → 1.06M shares (+13%)
AMD (AMD)
539K → 491K shares (−9%)
Applied Materials (AMAT)
291K → 563K shares (+93%)
Micron (MU)
117K → 237K shares (+103%)
Newmont (NEM)
2.7M → 2.1M shares (−22%)
Amazon (AMZN)
2.03M → 971K shares (−52%)
ISHARES INC
1.38M → 1.26M shares (−9%)
AppLovin (APP)
147K → 683K shares (+366%)
Shell (SHEL)
1.53M → 2.06M shares (+35%)
VANGUARD INTL EQUITY INDEX F
2.75M → 3.18M shares (+16%)
Oracle (ORCL)
1.43M → 1.18M shares (−18%)
Qualcomm (QCOM)
162K → 878K shares (+441%)
Meta (META)
110K → 220K shares (+100%)
Petrobras - Petroleo Brasileiro (PBR)
6.52M → 7.61M shares (+17%)
Alphabet (GOOGL)
1.32M → 460K shares (−65%)
Johnson & Johnson (JNJ)
669K → 548K shares (−18%)
Altria (MO)
1.73M → 2.1M shares (+22%)
ISHARES INC
1.33M → 1.65M shares (+24%)
EOG Resources (EOG)
539K → 948K shares (+76%)
Visa (V)
82K → 358K shares (+339%)
ISHARES TR
1.39M → 1.41M shares (+2%)
PG&E Corporation (PCG)
5.93M → 10.3M shares (+74%)
STATE STR SPDR S&P 500 ETF T: $2.6B, or 11.3% of the portfolio reported for Q3 2026.
Between its last two 13F reports, Bridgewater Associates opened 166 new positions, added to 472, trimmed 319 and sold out of 189. The comparison is in share counts, so a price move alone does not count as buying or selling.
Its 13F for Q3 2026 adds up to $23B. That is not the whole firm: a 13F lists only US-listed shares and some options held at the end of the quarter, and leaves out cash, bonds, short positions and foreign holdings.
The report for Q3 2026 was filed on Nov 16, 2026. A manager has 45 days after the end of each quarter to file, so the holdings are always several weeks old when they become public.
On 3,386 positions it reported as new or larger over 9 quarters, the typical one finished −0.9 points against the S&P 500 after 90 days, and 48% finished ahead of it. Measured from the day each filing became public; history, not a forecast.
Yes. Every page of OQRO is free with an account, which takes a minute with Google and needs no card. Only the AI assistant is paid.