Top 10 best-performing stock traders in Congress
Among the 41 members of Congress with at least 10 purchases measured, Shelley Moore Capito has the highest median result: +9.4 pts against the S&P 500, 90 days after each purchase was reported, over 19 purchases. Tim Moore (+5.3 pts) and Rick Larsen (+4.5 pts) follow.
The median of each member's disclosed stock purchases against the S&P 500, 90 days after the report became public. Only members with at least 10 measured purchases are listed. A short record can flatter anyone, and a past result says nothing about the next purchase.
Free, with no card and no paywall. This page needs no account; a free account opens the rest of OQRO, with alerts, watchlists and exports. Figures computed Nov 19, 2026.
The 10 highest median results, 90 days after each report
| # | Member | Median vs S&P 500, 90 days | Purchases measured | Finished ahead |
|---|---|---|---|---|
| 1 | 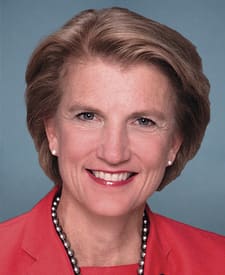 Shelley Moore CapitoRepublican, Senator, WV | +9.4 pts | 19 of 53 | 68% |
| 2 |  Tim MooreRepublican, Representative, NC district 14 | +5.3 pts | 59 of 59 | 59% |
| 3 | 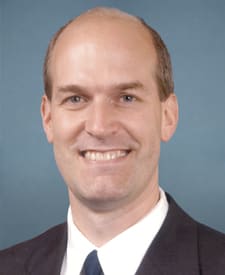 Rick LarsenDemocrat, Representative, WA district 2 | +4.5 pts | 17 of 44 | 65% |
| 4 | 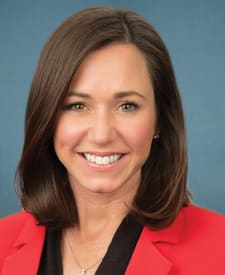 Katie Boyd BrittRepublican, Senator, AL | +3.9 pts | 11 of 11 | 73% |
| 5 |  Robert E. LattaRepublican, Representative, OH district 5 | +2.4 pts | 10 of 22 | 60% |
| 6 | 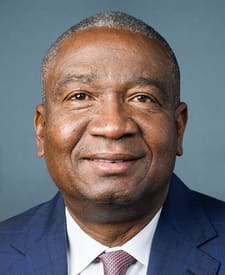 Cleo FieldsDemocrat, Representative, LA district 6 | +2.4 pts | 94 of 101 | 55% |
| 7 | 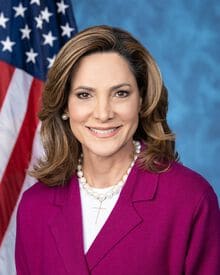 Maria Elvira SalazarRepublican, Representative, FL district 27 | +2.3 pts | 36 of 52 | 56% |
| 8 |  Julie JohnsonDemocrat, Representative, TX district 32 | +1.9 pts | 105 of 105 | 57% |
| 9 | 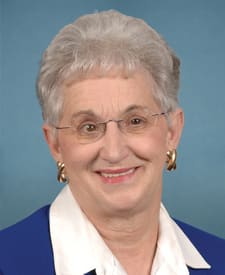 Virginia FoxxRepublican, Representative, NC district 5 | +1.8 pts | 26 of 195 | 62% |
| 10 | 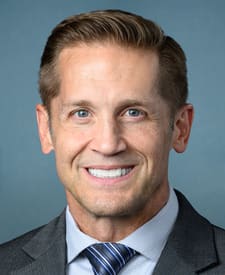 Richard McCormickRepublican, Representative, GA district 7 | +1.5 pts | 59 of 60 | 53% |
Points are percentage points against the S&P 500 over the same 90 days. “Finished ahead” is the share of measured purchases that did better than the index.
The whole ranking, beyond the first ten: The full leaderboard, with the lowest results too.
Common questions
Which member of Congress has the best stock trading record?
Among the 41 members of Congress with at least 10 purchases measured, Shelley Moore Capito has the highest median result: +9.4 pts against the S&P 500, 90 days after each purchase was reported, over 19 purchases. Tim Moore (+5.3 pts) and Rick Larsen (+4.5 pts) follow.
How is the result measured?
Each disclosed stock purchase is compared with the S&P 500 over the 90 days after the report became public, the first day anyone could have known about it. A member's figure is the median of those comparisons, in percentage points. Members with fewer than 10 measured purchases are not ranked.
Does this mean following these members makes money?
No. The list describes past disclosed purchases. The reports arrive up to 45 days after a trade, give amounts as ranges and include trades by a spouse or an adviser. A past result says nothing about the next purchase, and OQRO gives no investment advice.
Where does this list come from?
From the periodic transaction reports filed under the STOCK Act and daily closing prices. The same method is used for every member, and the full leaderboard shows the lowest results too.
Is OQRO free?
Yes. OQRO is free, with no card and no paywall: these lists, the company pages, the full history, the screener and the API cost nothing. A free account opens all of it, with alerts, watchlists and exports. Only the AI features (OQRO Pro) are paid.
Where these figures come from
Each stock purchase a member reported under the STOCK Act is compared with the S&P 500 over the 90 days that follow the day the report became public. A member’s figure is the median of those comparisons. Sales are not measured, and a purchase too recent to have 90 days of prices is not counted yet.
The reports give amounts as ranges and arrive up to 45 days after the trade; many trades are placed by an adviser or belong to a spouse. The list describes the past and is not investment advice. No language model wrote this page.